- MUCCnet: Munich Urban Carbon Column network. Atmos. Meas. Tech. 14 (2), 2021, 1111-1126 more… Full text ( DOI )
- Power Plant Emission Monitoring in Munich Using Differential Column Measurements. EGU2017-16423, 2017 more… Full text ( DOI )
- Methane emissions from dairies in the Los Angeles Basin. Atmospheric Chemistry and Physics (17), 2017, 7509-7528 more… Full text ( DOI )
- Differential column measurements using compact solar-tracking spectrometers. Atmospheric Chemistry and Physics (16), 2016, 8479-9498 more… Full text ( DOI )
- Study of Differential Column Measurements for Urban Greenhouse Gas Emission Monitoring. EGU General Assembly 2016, 2016 more…
Differential Column Measurements for Emission Estimates
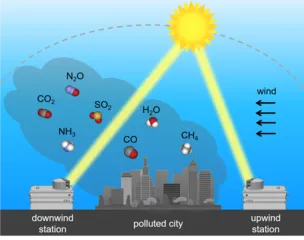
Differential column measurements is a novel tool for determining urban- and regional carbon fluxes, which are required in order to design and implement policies for emission reduction initiatives. We use compact solar tracking spectrometers (EM27/SUN) to measure the column-averaged concentrations simultaneously upwind and downwind of emission sources (e.g. power plants, landfills, refineries), inside and outside of a city. We have deployed differential column measurements in Munich, Indianapolis, San Francisco Bay Area, Chino (CA), Poland and are closely collaborating with Harvard University, KIT, Heidelberg University, UC Berkeley, BAAQMD, Caltech and LANL.
DFG project: Mesoscale Network for Monitoring Greenhouse Gas and Pollutant Emissions
Explanation of the principle
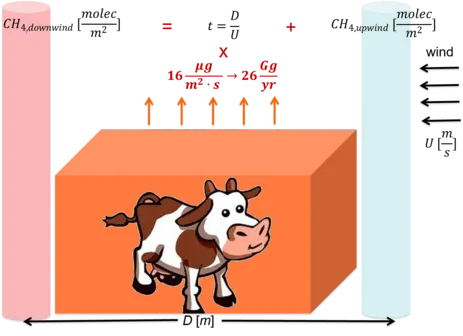
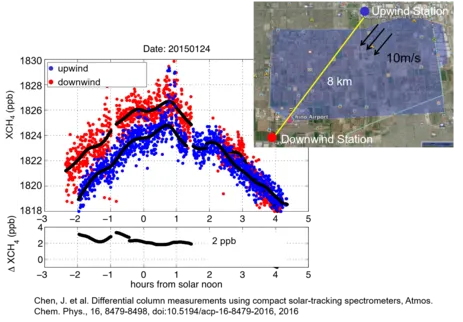
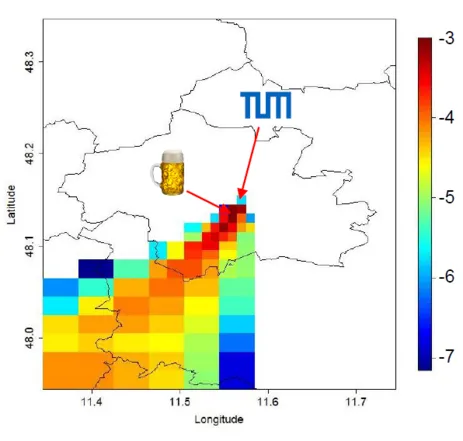
The basic principle of the differential column methodology is explained in the figures above. The upper right figure shows the measurement configuration (upwind and downwind of a dairy farm) and the measured column difference (2 ppb CH4). We are developing a data-model framework tailored to the differential column measurements to determine the emissions. The models that we are currently using include a simple column model (upper left figure), WRF-HYSPLIT, WRF-GHG, WRF-LES, and a computational fluid dynamics (CFD) model. An example of column footprints (logarithmic scale, bottom right figure) simulated using WRF-HYSPLIT to model the column differences measured during the Oktoberfest (bottom left figure) is given in the graphs below.


